Editor’s Note: This guide was written in partnership with Annette Franz, CCXP, CEO, founder of CX Journey Inc.
User experience (UX) is part of the bigger customer experience (CX) ecosystem. User experience focuses on user interactions with a product, whereas customer experience is centered around the customer (and the overall relationship), who might or might not be the end-user.
Whereas CX professionals talk about listening to the Voice of the Customer (VoC) across various touchpoints with the organization, UX professionals conduct research among users of their product, website, or application. This type of research is typically referred to as user research and it’s a critical step to designing the best user experience possible.
This guide explains what user research is, how it’s conducted, and the many ways it can be used to improve the user experience.
Let’s start with the key definitions.
Chapter 1
The user research
In its simplest terms, user research refers to the work that is done to understand users.
This work includes researching the user’s needs, pain points, problems to solve, jobs-to-be-done, preferences, behaviors, and motivations through the use of surveys, observation, and other evaluation methods. We’ll delve deeper into these various methods later in the guide.
User research is the foundation of user-centered design (UCD). According to the Interaction Design Foundation, user-centered design is defined as:
… an iterative design process in which designers and other stakeholders focus on the users and their needs in each phase of the design process. UCD calls for involving users throughout the design process via a variety of research and design techniques so as to create highly usable and accessible products for them.
This definition states that UCD is an iterative process based on user needs and the jobs-to-be-done. The only way we can truly identify those needs is through conducting user research.
Chapter 2
The importance of user research
At the heart of a great UX is the user. Brands should listen to them so they can design an experience that addresses their pain points and needs. And the only way to make this work is by talking to them.
User research helps us understand how the user goes about performing tasks and solving problems (through using your products, websites, and apps), and where inefficiencies and breakdowns happen so that those aspects can be redesigned or improved.
Ultimately, user research is used to design better products, websites, and apps that solve problems and deliver value for users. The research is the foundation of the design, adding context and insights to the design process.
Chapter 3
The jobs-to-be-done theory
We mentioned the jobs-to-be-done (JTBD) concept in the previous section. In order to define this term, let’s go to the creator and pioneer of this concept, Tony Ulwick, who said:
A jobs-to-be-done is a statement that describes, with precision, what a group of people are trying to achieve or accomplish in a given situation. Jobs-to-be-done could be a task that people are trying to accomplish, a goal or objective they are trying to achieve, a problem they are trying to resolve, something they are trying to avoid, or anything else they are trying to accomplish.
Jobs-to-be-done is uncovered through user research. Use this concept to ensure that designers focus on user outcomes, not just on features. When users achieve their jobs-to-be-done, it means they’ve successfully used the product and have received value as a result. Ultimately, this leads to satisfaction and repeat usage.
Chapter 4
Ownership of user research
Ideally, the UX designers and researchers within an organization will own UX research. We know that product managers do market research, helping to answer the question, “What problems are customers having that we must help them solve?” Product designers take into account both the market research and the business's needs. And UX designers conduct user research that informs the user experience, focusing mainly on users’ needs.
In reality, all three roles need to work together; it’s the only way the product or interface will deliver on the problem it is supposed to solve in an easy-to-use way and, therefore, actually be useful for the user.
Chapter 5
Qualitative vs. quantitative research
Like any other research you can conduct, there are two overarching types of user research: quantitative and qualitative. These two methods can be further broken down into attitudinal and behavioral research, where attitudinal is what people say, and behavioral is what people do. These will be discussed later in the guide.
Quantitative user research
Quantitative research speaks to forms of research that are quantifiable, such as the number (or percentage) of people who said or did something. This type of user research is typically conducted using surveys or feedback buttons, as well as A/B testing, clickstream analysis, site analytics, user session data, app analytics, search logs, and bug tracking.
Qualitative user research
Qualitative research speaks to forms of research that are exploratory in nature. This type of research allows us to have conversations (e.g., interviews) and probe deeper into the “Why” of the finding. In addition to conversations, qualitative research is conducted through observation.
Examples of qualitative user research include scripted and unscripted 1:1 interviews; ethnographic interviews and immersion programs, where users are observed in their homes or offices as they use the products; usability tests; focus groups; eye tracking; and card sorting.
Chapter 6
Other user research methods
Listening via both quantitative and qualitative methods is important. But there are other research methods that we want to call out that are standard fare–and must be in your toolbox–to understand users and their experience.
Personas
Personas are descriptions that represent a behavioral grouping of like users, i.e., users with similar needs, pain points, problems to be solved, and jobs-to-be-done. The persona descriptions include vivid narratives, images, and other items that help designers understand who their users are, understand the needs of the user (contextual insights), and outline motivations, goals, behaviors, challenges, likes, dislikes, objections, and interests that drive purchase or usage decisions.

Personas are derived through primary research (e.g., interviews, surveys, ethnographic research) and can also include existing behavioral data to develop a complete picture.
Empathy maps
Empathy maps are not the same as a persona profile, nor are they journey maps. Here’s what empathy maps are, straight from the creator’s (Dave Gray, founder, XPLANE) mouth:
[Empathy maps] help teams develop deep, shared understanding and empathy for other people. People use it to help them improve customer experience, to navigate organizational politics, to design better work environments, and a host of other things. The empathy map was created with a pretty specific set of ideas and is designed as a framework to complement an exercise in developing empathy.

Empathy maps visualize what you know about users, specifically what they are feeling, thinking, doing, seeing, and hearing, as well as their pain points and desired outcomes. They help us to create a shared understanding of the user so that we can better design for their needs.
Learn how a product designer from Usabilla created personas and empathy maps for a redesign of their feedback form.
Journey maps
Journey maps are visualizations of the steps users take as they complete some task or interaction. They include what the user is doing, thinking, and feeling at each step of the journey to complete the task using your product, website, or app.
As with other user research methods, journey maps are created with the user, from the user’s viewpoint. The foundation of the journey map is the user persona; different personas have different experiences, so it’s important to look at and define the different journeys for each unique persona. To learn more, check out our journey mapping guide.
Research learning spiral
Erin Sanders, a senior interaction designer at Frog Design, created a research learning spiral that guides researchers on how to plan and conduct user research.

The spiral has five steps that take you from plan to outcomes. They are as follows:
Objectives: What questions are you trying to answer? Why are you doing this research?
Hypotheses: What do you think you already know about your users, their behaviors, pain points, problems to solve, etc.?
Methods: What research tool or method will you use to fulfill your objectives?
Conduct: Use the chosen method to gather data and understand your users.
Synthesize: Analyze and make sense of the data, and use your research findings to either prove or disprove your hypothesis.
Before we talk about how to conduct your research, let’s discuss how to set up your program.
Chapter 7
Setting up your user research program
A successful user research program starts with a well-thought-out plan. This means addressing the 5 Ws (Who, What, When, Where, and Why) of the research first.
Let’s review the various considerations of your research plan by posing a series of questions to answer for each.
Ownership
Who owns the research? What is their name, title, department?
Background
What’s the backstory for the research? What are you working on that requires this type of research? How will you build the business case for this research? What will success look like?
Objectives
Why is this research being conducted? What’s the purpose? What are you trying to uncover? What questions are you trying to answer with this research? Are you doing the research to understand your users, or are you doing the research to identify whether the product, app or website, meets their needs or helps them solve some problem? And if not, are you looking to understand what you can do to improve it?
Hypothesis
What do you know (or think you know) about your users? What do you know about their behaviors? Their pain points, problems to solve, jobs to be done, etc.? What will you try to prove, disprove, or otherwise learn more about in this research?
Stakeholder
Who is this research for? Which department? Who requested it? What are their needs? What questions are they needing to address? Why did they request it? What will they do with it?
Audience/Participants
Who will participate in the research? Who will you survey or interview? Is it one persona or a variety of personas? Why are you focusing on this particular audience? What is their connection to the product, website, or app? Where will you find these participants, i.e., are they existing customers or will you buy a list? How will you recruit them?
Scope
What type of research are you conducting? Will the research be quantitative or qualitative? Or will you use both types? Which type of research tool or methodology (i.e., survey, interview, feedback button, ethnographic research, etc.) will you use to conduct this research? What questions do you need to ask? How will they be asked?
Depending on the type of research tool chosen, there will be a lot of other questions to ask specifically to each tool. For example, for interviews: Will the interviews be conducted by a third party or by someone internally? How long will they be? Will they be 1:1 interviews? Will they be scripted or unscripted? Will the interviews be recorded (audio and/or video)?
Timeline
When will this research be conducted? What are the key milestones and individual tasks? How long will each take? Who owns each task? When will the research be completed?
Cost
How much will the research cost? Did you get a quote from an outside vendor? Or do you currently have your own feedback platform to use for this research? What is included in that cost? Have you included incentives as part of the qualitative research cost?
Depending on the type of research chosen, there will be other questions and considerations when it comes to costs.
Once you’ve built the business case and gotten approval for your plan, it’s time to dig in and conduct your research.
There are a plethora of ways to conduct user research, as we’ve already mentioned. But for this section, we’ll focus on the value of surveys and feedback buttons for conducting user research about your site or application.
The simplest, least time consuming, and most effective way to gather user feedback is by inserting a pervasive feedback button on your website or within your app that users can click on at their convenience.

(Usabilla feedback button)
You can design the feedback mechanism to be as simple (about a specific part of a page) or as detailed (general site feedback) as you like. The real-time nature of the feedback that you get through these buttons allows you to act upon issues fairly quickly.

(Usabilla specific feedback screenshot functionality)
Targeted, in-the-moment surveys that reside within the user’s browser are another way to gather feedback and metrics about the user experience. They can even be designed to ensure that you ask the right questions of the right users.

(Usabilla slide-out survey on mobile)
The most popular of these are slide-out surveys, but you can also use full-screen surveys. Targetted, in-the-moment surveys can also be used to recruit participants for a more-detailed form that can be sent via email.
You can also capture user attitudes by embedding feedback icons (thumbs up/thumbs down, smiley face/frowny face) to understand the quality of the content they are receiving or seeing in your knowledge base or FAQs.
See how Genesys, a global leader in customer experience and contact center solutions, improves documentation and support with embedded feedback.

(Usabilla embedded feedback icons)
Chapter 9
Behavioral and attitudinal metrics
For a detailed look at the key metrics behind user research, read our UX metrics guide. You’ll learn all aspects of behavioral and attitudinal metrics. Below is a recap of each.
Behavioral metrics
There are a lot of behavioral metrics that you could use, but here are some of the common metrics that will help you measure and track the quality of the experience.
Many UX designers utilize the PULSE metrics, but just know that these don’t provide a complete picture or the context you need to understand the “Why?” behind the metric. These include:
Pageview: the number of pages a visitor viewed.
Uptime: the percentage of time users can access your site or your app.
Latency: the lag time or hang time. For example, when you click the button, how long it takes to go to the next page.
Seven-Day Active Users: the number of unique users on your site or app within the last seven days.
Earnings: revenue generated by the site or product.
Other popular behavioral metrics include:
Time on Task: how long it took the user to complete a task.
Task Success Rate: the number of tasks completed correctly divided by the number of attempts. (It’s important to define what success looks like first!)
User Errors/Error Rate: how many times a user makes a wrong entry.
Abandonment Rate: how often users left without completing the task. For example: filled the cart but didn’t make the purchase.
Attitudinal metrics
Attitudinal metrics are what people feel or say about your product. There are far fewer attitudinal metrics than behavioral metrics, but they’re equally important. UX leaders typically use the following metrics to capture those feelings.
System Usability Scale (SUS)
System Usability Scale is a popular metric used by UX researchers and designers. It comprises ten questions answered on a five-point agreement scale about the experience with the product or website. The questions are centered around ease-of-use but don’t provide any sort of diagnostic details. The score itself is a bit complex to calculate, but it has become an industry standard and commonly-used metric.
Satisfaction
You can’t go wrong using satisfaction as an attitudinal metric. It’s the go-to metric, without a doubt. How satisfied the customer is with the user experience of your product or website–down to features and functionality–will certainly affect their overall satisfaction with the brand.

(Usabilla CSAT slide-out survey with open-text box)
Star Ratings
Star ratings have become synonymous with site reviews or online feedback. There’s not even a scale or a specific question asked, it’s just “How would you rate your experience on our website?”
Users rate the experience from one to five stars. This is a simple, yet effective, way to find out how users feel or think about your app, site, or product. It’s also important to include an open-end question that allows the user to provide some detail behind the rating.

(Usabilla emojis used to track emotional rating score)
Usability
An ease of use/ease of task metric is probably one of the most coveted metrics for the UX designer. Remember why measuring UX is important? The goal of user experience is to improve satisfaction and loyalty through utility, ease of use, and pleasure.
You can’t deliver those outcomes (satisfaction and loyalty) if you don’t do a good job understanding utility, ease of use, and pleasure. Many will opt for the SUS metric, but a simple effort/usability metric will work too.
Net Promoter Score (NPS)
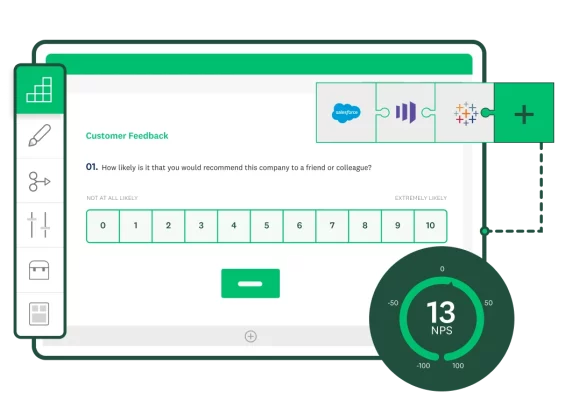
NPS states an intention to do something based on how you feel. If someone is likely to recommend your product, your app, or your site based on the experience they had using it, then the experience might have been a good one.

(Usabilla NPS survey question with option to add contact information)
NPS at a purist level is a relationship metric, and a high NPS might be a result of the overall experience with the brand, not just on what the user experience was. While many advocate for NPS as a top UX metric, use it cautiously and know that you will need more data to understand the score.
For instance, comparing your NPS score from digital visitors to your site in different countries can be advantageous. You might find there is a significant difference. If that’s the case, then you should collect other data, both behavioral and attitudinal, to understand the variations between these two regions so you can implement the needed changes.

(Usabilla dashboard of NPS comparison across countries)
Metrics are just one way to look at the data gleaned from your user research. You’ll want to analyze it to tease out insights and uncover the story.
Chapter 10
Analyze your user research
Through analysis of your user research data, you’ll learn more about the product you are designing and the people for whom you’re designing it.
To begin your analysis, go back and look at your objectives (and your hypotheses, if you’ve outlined those) and address the questions posed. If you can’t answer those questions in your analysis, then something went wrong with your research process.
You should also involve your stakeholders, at this point. Bring them in to discuss the analysis plan that will best deliver the findings and insights to address their needs and questions.
Begin by organizing and centralizing all of your research in order to simplify the analysis process. Your qualitative research ought to be analyzed in conjunction with the quantitative because the former will answer the deeper question, “Why?” when the quantitative data cannot. For the qualitative data, i.e., user comments, transcriptions of audio/video recordings of interviews, etc., you’ll want to be sure to prepare it for subsequent text and sentiment analysis.
Analysis takes many forms because there will be many different types of data to make sense of. For the quantitative data, you will crosstab, predict, identify key drivers, and prioritize improvements. The qualitative data will be mined for themes and sentiment through text analysis tools. You’ll likely need to conduct a root cause analysis to understand the deeper why behind design issues.
Ultimately, your analysis will result in findings (facts) and insights (conclusions based on facts). And those insights should then be reframed into user problems–keeping the user at the center of this research–that you will then solve in your updated and improved design.
Once you’ve completed the analysis, it’s time to get the information into the hands of the people who need to use it.
The next step is to socialize the findings and insights in an easily-digestible way so that the right people use them to understand users and to improve the experience.
First and foremost, these insights must be shared with your stakeholders, so that they can review them, ensure their questions have been appropriately addressed, and then outline for themselves and their teams how they will use what’s been learned.
There are multiple ways to socialize the research, but be sure to tailor the delivery method and the insights to the audience and the expected and desired outcome. Begin by asking your stakeholders how they’d like to receive the findings.
Beyond that, some or all of the findings and insights must be socialized with the larger organization. You’ll need to determine which are relevant and for whom. It will be up to you and your stakeholders to decide which research artifacts (e.g., interviews, videos of users using your products or website, etc.) are worthy of sharing and with which departments and employees.
For example, earlier, we wrote about personas. Persona artifacts are certainly top of the list to share with others in the organization. Putting users front and center, and helping fellow employees understand who your users are, will build more empathy for them across the organization.
Once you’ve socialized your findings, you need to ensure they’re acted upon.
Chapter 12
Operationalize the user research
It’s not enough to socialize the research. Ultimately, it must be acted on and operationalized. You know what needs to change or improve based on the analysis. Now create action plans, assign owners, outline metrics and accountability, and implement the improvements or design products that will solve problems for your users.
Track and measure your efforts in order to maintain a continuous improvement cycle. Take a look at your success metrics to ensure you’ve achieved your goal(s), then close the loop with stakeholders and users. And don’t forget to close the loop with employees.
Designers and researchers are often asked to show the return on investment (ROI) of their work. What metrics will you use to prove the ROI from your user research efforts?
Check out the UX metrics guide for details behind showing ROI. Below are examples of outcomes for the user and the business.
User outcomes include:
Ease of use.
Goal completion rates.
Satisfaction/great experience.
Solved problem/achieved job.
Business outcomes include:
Increased conversion rate.
Lower acquisition costs.
Increased purchases/reduced cart abandonment.
Reduced support volume/costs.
Reduced development costs.
Increased retention and referrals.
Linking the user problem or pain point that is eliminated as a result of conducting the research, and making changes or improvements to business outcomes, will be the key to showing ROI.
Conclusion
There is much to be written and learned about user research—we have only scratched the surface in this guide.
But know this: without understanding the user and the problems they’re trying to solve (aka, the jobs-to-be-done), it will be difficult to design a product, website, or app for them.
If you overlook this important part of the design, you will end up looking for customers to use your products rather than products for your customers. The latter is much more lucrative.
Our sister company, Usabilla, can help you jumpstart your UX metrics program today. Click here to learn more.
Chapter 11
Socialize the user research