The best organizations in the world do three things really well.
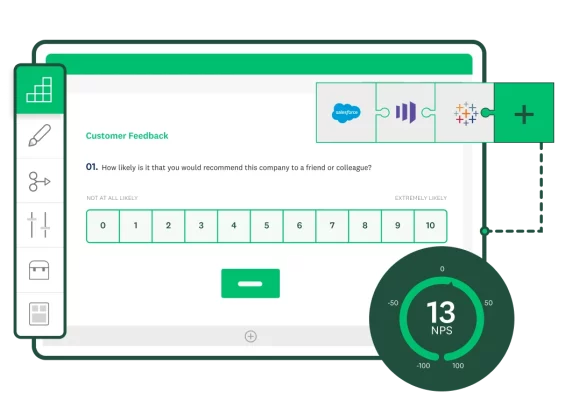
One, they understand their customers and track their experiences through customer experience metrics like Net Promoter Score (NPS), Customer Satisfaction Score (CSAT) or Customer Effort Score (CES).
Two, they leverage those findings and re-invest in the customer experience.
And three, they understand and communicate how these customer-focused metrics are related to the overall performance of their organization.
Are your customer experience results drivers of your organizational outcomes?
YES! Let’s explore some of the most common ways to do this, and hopefully inspire you to find your own.
Chapter 1
Overall revenue results
If your business tracks outcomes like gross revenue and profit, it’s worth exploring the connection between these basic business results and your CX metrics. You may think this isn’t possible, but with the right baseline and consistent metrics, it is.
Consider the relationships between month-over-month revenue and your monthly CX metrics. As an example, let’s explore the relationship between a standard NPS metric and your quarterly results.
By tracking how your customer experience improvements are positively impacting your NPS results, you can begin to watch when there is a relationship to your top-line revenue numbers. There are also some established benchmarks for certain industries, most well-known is Forrester’s Customer Experience Index. The CX IndexTM shows how a 1-point improvement in the Index score leads to annual incremental revenue per customer. Apply this to your organization and you might see major results!
Chapter 2
Sales and customer experience
The relationship of sales and CX is the yin and yang of the entire customer journey. Your sales process sets the stage for your customer experience. Your sales people and processes create the expectations for your prospects. And your customer’s delight or disappointment in their experience as customers reflects how well these expectations were set.
There are several connections to watch between sales metrics and CX metrics, including:
NPS asks the question, “Would you recommend our product or service to your friends or family, why or why not?” While the overall score helps you see the patterns, these answers to why or why not provide a lot of information about your customer’s expectations and the variance of their experience. If most of the disappointed customers report feeling the experience isn’t meeting what the sales process promised, then you may have an issue with setting expectations early in their journey.
Sales get better when your happy customers tell others! If your sales cycle is getting shorter, you may have your customer experience to thank. To understand the connection, look at the numbers of inbound prospects. If more prospects are seeking your brand out, then your customer experience is most likely improving.
Customer Effort Score (CES) is often a leading indicator for better word-of-mouth (WOM) marketing. As you see your customers feeling like your brand provides an easier, more effortless experience, they are also more likely to advocate for your brand. Positive word-of-mouth marketing leads to more proactive sales. Are your prospects completing your web form and signing up for your products? More referrals lead to higher sales.
Another angle for your Chief Financial Officer
Here's some good news. Executing on a customer experience strategy in the right way can actually reduce expenses in your organization. There are only two ways to increase net profit, make more money or reduce expenses. Reducing expenses with customer experience means more top-line revenue for your brand.
Better customer experience metrics often lead to reductions in the following expenses.
Chapter 3
Cost of service
When your customers are delighted, they don’t have the need to call into your contact center to complain or request help. They are moving through their journey with ample guidance and the right expectations. There is a smaller group of them running into issues because everything is working as it should.
Many companies begin investing in customer experience almost exclusively with this goal in mind. After realizing the expense of the technology, tools and even the real estate of a contact center, smart leaders began to see how a reduction in these expenses would lead to a better bottom line all around.
Connecting your CX metrics like CSAT or NPS to this type of expense reduction can be fairly straightforward. There may be a monthly lag, but as your CX scores improve, watch for your contact center costs to go down.
Consider an equation that determines what this reduction means for your organization.
If you have an average of 100,000 calls into your contact center on an annual basis, and each of those calls costs your organization $7, then reducing that inbound call number can mean serious savings. Let’s say you manage to reduce the number of calls by 10% annually. That’s 10,000 fewer calls! Using these numbers, that’s a $70,000 savings to your organization each year.
The brighter side is that your customers are finding what they need, feeling served, and not requiring as many calls to get help!
Chapter 4
Customer defections
When customers leave a brand for a competitive brand, it’s more than just the loss of their next transaction. It’s the loss of a relationship. This reduces the Customer Lifetime Value (CLV) and may lead to more negative word-of-mouth marketing, more defections, and eventually an increasingly competitive marketplace.
Do you know how many customers leave you in a month, a quarter, a year? If not, it’s a very good metric to track, especially for business-to-business (B2B) or subscription models.
If CSAT or NPS begins to fall, watch your customer defection rates carefully. Even if you are acquiring more new customers each month, this metric should be tracked as an indication of how your current customers are feeling about their experiences.
On the other side of this coin, watch as your retention rates go up with how that impacts your business for the better.
Chapter 5
Churn rate
While retention is worth tracking on its own, churn rate combines retention with new customer acquisition. This means examining the rate your customers are coming in versus how many are leaving you during a certain timeframe, typically monthly, quarterly and/or annually.
This result has an inverse relationship with your CX metrics. As your Net Promoter Scores increase, your churn rate typically declines. What will keeping more customers and acquiring more do for your business? It’s the very definition of growth!
Your business outcomes really come down to a few basic things:
Are your prospects finding your brand when they have a need, and believing your company can provide that need?
Are they buying what you are selling?
Are they happy to be your customer? Not just after the first sale, but in an ongoing relationship?
Are they telling others about your brand? Are they doing so in a positive or a negative way?
Customer experience metrics tell you about the first part of the story. Combining these outcomes with business outcomes tells you the whole story of your business AND your customer experience.
The Catalogue of Customer Experience Metrics
Get the GuideLearn how GetFeedback can help you exceed customers’ expectations—start your free trial today.
About the guest author
Jeannie Walters, CCXP, CEO, Experience Investigators™ by 360Connext
Jeannie Walters is a Certified Customer Experience Professional (CCXP) and is CEO of Experience Investigators. She is a customer experience speaker, writer, and consultant with more than 20 years of experience in assisting all types of companies, including Fortune 500. Specialties include in-depth customer experience evaluations, customer journey mapping, user experience analysis, and leading workshops and training programs. Her mission is: To Create Fewer Ruined Days for Customers.™ Connect with her: experienceinvestigators.com | @jeanniecw