There are a lot of customer experience (CX) metrics at our disposal that add value to a customer experience program. However, not many experience professionals dare to venture off from the familiar, traditional metrics to explore what else is available.
Oftentimes this is because there is a lack of resources—managing one or two metrics is all one person or team can handle; other times it’s simply a symptom of the embarrassment of riches—too many choices can be too overwhelming and we end up not making any moves.
Whatever the reason, we’re here to help. This guide features the most popular customer experience metrics, catalogued by purpose and best use case. If you're a seasoned CX professional, use this library to strengthen the connection between your efforts and business results. And if you’re just getting started, you should leverage this list will help you create a plan.

Chapter 1
Customer experience metrics
The three core customer experience metrics are the Net Promoter Score (NPS), Customer Effort Score (CES) and Customer Satisfaction Score (CSAT). Most companies use at least one of these three metrics to measure the performance of their customer experience program. Ideally, you should use all three strategically. Let’s go over each one.
Net Promoter Score (NPS)
NPS is quite popular in executive circles because it’s easy to understand and communicate the concept of increasing advocacy. It’s also the most commonly used metric overall—by 83% of CX programs, according to a CustomerThink study.
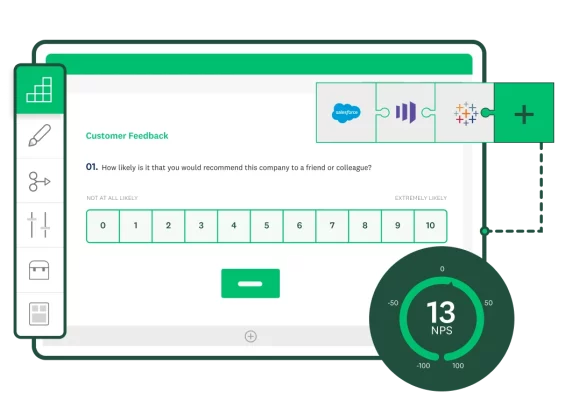
Net Promoter Score (NPS) asks the question: “How likely are you to recommend us to a friend or colleague?”
The respondent ranks their likelihood on a scale of 0 to 10—0 being highly unlikely, 10 being extremely likely. You can also add an option for the respondent to leave a comment and explain his or her rating. On the rating system, people who select 9 or 10 on the NPS survey are considered Promoters, people who select 7 or 8 are Passives, and people who select 6 or below are Detractors.
To calculate the NPS score, you subtract the percentage of Detractors from the percentage of Promoters (percent Promoters – percent Detractors = NPS).
Also, it’s a good idea to ask one open-ended question in your NPS survey to give customers a chance to explain their ratings, or to share issues not represented in the survey.
An NPS rating score above 0 is considered good, an NPS score above 50 is considered excellent, and any score that is 75 and above is considered world class.
Use NPS to create a customer-centric culture
The Net Promoter Score is considered a relationship metric, which means it’s best used to evaluate the overall customer relationship and end-to-end experience.
It’s a great indicator of how your customers are feeling about the overall brand and relationship. But that’s only if it’s used very consistently and communicated throughout the company.
Communicating throughout the organization doesn’t mean just reporting out the NPS numbers. You have to act on your NPS data across departments to see real improvements. Here are some ideas to consider:
Share the consistent issues with the appropriate team and strategize with them to apply improvements. For example, If delivery is frequently mentioned as an issue to your Detractors, then get that department involved in the CX conversation.
Seek out ways to connect with your Promoters. They took the time to share their positive feedback; show them your appreciation by inviting them to your customer advisory boards or special customer events. Some CEO’s even call a few Promoters each month to say thank you and hear from them directly.
Don’t shy away from your Detractors—listen to their complaints. Calling them can be a little daunting, but you should still do it. Inviting them to share their concerns directly with someone at your organization is a great way to recover from a potentially problematic event.
Communicate throughout the company that the NPS metric isn’t just a number. It’s a measurement of how your customers feel about their experiences and relationship with your overall brand.
There are some cases when NPS can work at a touchpoint level. Such as, when the main source of value and referral behavior is based on that touchpoint. For example, you could use a variant of NPS (would you recommend us to a friend?) after support calls if you know they highly impact customer loyalty.
Lastly, keep in mind that NPS has some technical challenges because it’s calculated by subtracting two percentages. Meaning, two companies can have the same NPS score, but quite different compositions of Promoters and Detractors. For example, an NPS of 20% can be achieved with 60% Promoters minus 40% Detractors or 25% Promoters minus 5% Detractors. However, this issue doesn’t matter as much to brands that use NPS as a high-level measure of brand loyalty.
For more, check out our NPS guide.
Customer Satisfaction Score (CSAT)
The Customer Satisfaction Score is assessed by asking customers: “How would you rate your overall satisfaction?” with your company and its products, services, and interactions.
A five-point scale is most commonly used, with options very unsatisfied, unsatisfied, neutral, satisfied, and very satisfied.
There are two ways companies can calculate CSAT: an average of 1-5 or by focusing on the 4-5 responses.
GetFeedback recommends using this formula: (Number of 4 and 5 responses) / (Number of total responses) x 100 = % of satisfied customers.
While you can use CSAT as an average, that isn’t as useful as calculating the percentage of those customers who consider themselves satisfied. If you stop and think about it, that makes sense—the metric is looking at the percentage of happy customers specifically.
The final score is typically represented as a percentage of the maximum. With a five-point scale, for example, a CSAT rating of 80% means that the majority of customers are giving a satisfied rating (4 out of 5).
Like the NPS survey, with a CSAT survey you can also add an option for the respondents to leave a comment and explain their rating.
A CSAT score of 80% is a good indicator of success, although it will vary by industry. For the latest CSAT benchmarks, check out this article.
CSAT pros and cons
The Customer Satisfaction Score is a statistically sound metric. Most people are used to answering the satisfaction question of rating a brand on a 1-5 scale, so it’s easy to understand and implement. It’s also the second most popular metric (right after NPS)—by 69% of CX programs, according to a CustomerThink study.
However, the wording of the CSAT question is not standardized, making it difficult to compare scores from different organizations. And, merely satisfied customers is a fairly low bar that may give organizations a false sense of security because it doesn’t necessarily lead to loyalty.
Like NPS, the Customer Satisfaction Score is considered a relationship metric, which means it should be to evaluate the overall customer relationship and end-to-end experience. For this particular purpose, CSAT should be measured annually and possibly every 90 days to get an overall assessment of a customer’s satisfaction with the experience.
However, unlike NPS, the Customer Satisfaction Score is also a touchpoint metric. This type of metric is used to capture feedback after individual customer interaction with different parts of the brand. So, instead of relying on NPS for understanding specific parts of the customer journey, CSAT can help you zero in on one stage, one touchpoint, or one relationship.
Customers may conflate the entire journey when asked if they would recommend their most recent experience to their friends or colleagues in NPS questioning. However, customers will be able to provide important feedback on the 5-point scale of CSAT specifically around the delivery experience, for example.
Use CSAT to improve touchpoints along the journey
Customer-centric brands use CSAT with the intention to create specific improvements along the customer journey. Here are some examples:
Use CSAT to incrementally measure touchpoint improvements. Once a touchpoint is changed for the better, validate that with your customers by comparing CSAT before and after those improvements roll out.
Identify the specific goals the customer has at each stage in their journey; then use the CSAT metric to understand if those goals are being met. If satisfaction is lower at a particular stage, that’s where improvements should be prioritized.
Use CSAT to track the satisfaction of big, complex interactions. Such as: buying cycles and complex B2B service issues that aren’t resolved with just one call. After the resolution, ask the customer for their satisfaction levels. Service recovery should build loyalty by taking care of customer problems. If that’s not happening, CSAT will tell you.
Review CSAT throughout the journey. Even if you are collecting CSAT at specific interaction points, take a step back and review the big picture of these scores within your overall customer journey. The lower scores highlight gaps in the experience. Address those improvements and watch the scores rise again.
By being hyper-focused on specific interactions, CSAT helps you discover gaps in your customer experience program and make improvements across the customer journey.
For more, check out our CSAT guide.
Customer Effort Score (CES)
The Customer Effort Score (CES) asks the customer to score the amount of effort involved with a specific interaction.
The CES survey asks customers to agree or disagree with the statement: “[Placeholder for company name] made it easy for me to handle my issue.” You can also include an open-ended follow-up question that asks for feedback on the response. The respondent can choose from 7 answer choices ranging from strongly disagree (score 1) to strongly agree (score 7).
To calculate your company’s CES, find the average of all responses. Use the total sum of responses, then divide by the total number of survey respondents. The equation: (Total sum of responses) / (Number of responses) = CES score.
When it comes to evaluating your CES score, generally speaking, an average Customer Effort Score that is more than 5 is good. A score that is 5 and lower is not. Some theorize that you actually don’t want a perfect score, because that shows your customers aren’t putting in any effort themselves to get their questions answered, etc. So somewhere between 5-6 is the sweet spot. If you’re averaging at a CES of 7, especially when measuring for your support team, you might want to encourage more self serve.
Why CES matters
The Customer Effort Score has gained popularity as a metric aimed at reducing the effort in customer service or other routine interactions. If the primary value proposition of your brand is fast and easy experiences, such as Amazon, then CES could work well as a brand loyalty indicator. However, for the rest of us, CES is best used in customer service or other routine experiences where low effort is the main loyalty driver.
CES is another touchpoint metric. As effortless experiences become the expected norm, this metric will help guide your strategy to create less effort for customers throughout their journey.
Use CES to reduce effort at key touchpoints
Successful CX programs use CES to measure how a customer feels across the journey and what actions are leading them to feel that way. Here are some examples:
A customer might report high satisfaction with the buying phase (via CSAT), but report the purchase online required more effort than they would’ve liked (via CES). Determine what factors led to the feeling of effort for the customer, then provide improvements or peripheral guidance like additional instructions, online support, real-time chat, etc. Then measure CES again and see the results of your efforts.
Tie your CES score to referrals and word-of-mouth marketing. Bring your CES up and watch your referral rates and social media sentiment increase. This can also be measured in reverse–as your CES dips, pay attention to the way customers are discussing your brand.
CES is great for soliciting open-ended feedback from customers who may have great ideas on how to reduce the effort for their fellow customers.
For more, check out our CES guide.

Chapter 2
Customer Loyalty Metrics
In a sense, all customer experience metrics track loyalty. However, there are particular measurements that you should use to predict the level of customer loyalty.
Loyalty is an emotional state that is reflected in the behaviors that customers exhibit with your brand. Such as:
Do they stay with your brand or go to your competitors?
Are they buying more from your brand?
Are they willing to pay a premium?
Will they refer your brand to others?
Let’s explore some of the ways to track these behaviors which can help predict how loyal customers feel about your brand.
Retention
Retention is probably the most straightforward way to track your customers’ loyalty. It measures how long your customers stay with your brand. While the concept is straightforward, there are different ways of tracking retention, so be sure to use the method that makes the most sense to your company.
It’s important to distinguish retention from customer churn. Retention looks at: “This many customers, from this specific group, stayed this month.” While churn addresses: “This is how many customers left this month, compared to our overall customer number.”
This can get confusing, so here are some easy definitions:
Retention = the percentage of customers—from a group of existing customers—who stayed this month.
Churn = the percentage of customers who left this month compared to all customers this month (including those just acquired).
So, let's say at the start of a month there are 100 total customers. Of this group, 80 are ongoing customers, 20 are new, and 10 leave at the end of the month.
Retention rate = 87.5% retention (80 - 10 = 70 ÷ 80)
Churn rate = 10% (10 ÷ 100)
When possible, track retention based on individual customers. Retention should not be measured as a whole number (Ex: Do we have more customers in May than April?) because that may include new customers and ignore churn.
By tracking at the individual level, you’ll be able to determine the percentage of customers who remain and the length of time they are likely to stay. For instance, if you know how many customers remain until the sixth month, you can evaluate those key touchpoints on the journey.
The retention rate is a powerful metric. Think of the cost of gaining a new customer—sales, marketing, onboarding, etc.—versus keeping a customer. The cost to keep that customer is much lower and the gains are much higher. And if customers are sticking with you longer, they are telling you they are happy with the experience.
Share of wallet
Loyal customers will choose to spend a portion of their budget on your product or service as opposed to your competitors. The percentage of money that goes to your brand versus your competitors is called share of wallet.
Let’s say that a customer named Susan has allocated $10.00 per month to spend on coffee and she likes to buy a cup every two weeks. Since Susan lives near Starbucks and Philz Coffee she decides to try both brands, just once, in one month. Both coffee shops will charge her $5.00 a cup. Therefore, both brands will have 50% share of wallet for that month.
Share of wallet represents how much a consumer regularly spends on a specific brand as opposed to its competitors. This can tell you a lot about loyalty. These customers are also most likely to recommend your brand to others and increase their purchase value.
Referral rates
It’s hard to think of something more gratifying than your customers referring your product or service to their peers and loved ones. These customers are loyal because they feel a sense of kinship with your brand.
Tracking your referral rates is a great way to see if you are creating and developing these advocates in your organization. Your referral rate is the volume of referred purchases as a percentage of your total purchases. So a 1% referral rate means that 1 in 100 purchases at your company happen through your referral program.
If you don’t already have a loyalty and referral program, it's worth evaluating. Referrals don’t require the same costs of marketing, sales or even prospect education as other methods of customer acquisition. And make sure you reward these customers advocating for your brand, even if it’s just by simply recognizing their support.
Cross-sales and up-sales
The share of wallet value can sometimes be tricky—you may not feel totally confident in the industry averages, or those numbers can often lag behind reality. A direct way to track a similar behavior in your customers is measuring cross-sales and up-sales.
Cross-selling invites customers to purchase related or complementary items. While upselling encourages customers to purchase a comparable higher-end product or service than the one in question.
Tracking month-over-month or quarterly sales per customer and translating that to cross-sale percentages is another way to predict loyalty. If you do have premium products or obvious up-sale opportunities, identifying those in your metrics can contribute to understanding how your most loyal customers behave.
Watch for patterns such as:
Did the customers who made a second purchase do so at a similar place in the customer journey?
How did your up-sales occur? Did they require salespeople or high-touch relationships?
Did any customers ask for refunds or discounts for these sales?
Calculate what a higher percentage of premium sales means for your company. For example, if you currently have 500 premium purchases per year from existing customers, and each premium sale means a $500.00 increase, then that means these sales are providing $250,000 annually. If you increase this by 50% in sales from existing customers, then you’ll have an additional $125,000.
And remember, this isn’t about increasing sales tactics. These are existing customers who are happy and loyal. They see the value of the premium and appreciate the offer. This isn’t about increasing sales tactics.

Chapter 3
Business outcome metrics
Customer experience metrics only tell one part of the story. You must combine your CX results with business outcomes to show the entirety of your performance. This chapter explores some of the most common methods of demonstration that your CX results are contributing drivers of your company’s business growth.
Overall revenue results
Making the connection between your company’s gross revenue/profit and your customer experience efforts is key to your program’s success. With the right baseline and consistent metrics in place, it’s easier than you think.
As an example, if you track how your customer experience improvements are positively impacting your NPS results, and you’ll begin to see there is a relationship to your top-line revenue numbers.
There are also some established benchmarks for certain industries, most well-known is Forrester’s Customer Experience Index. The CX IndexTM shows how a 1-point improvement in the Index score leads to annual incremental revenue per customer. Apply this to your organization and you might see major results.
How to Calculate the ROI of Customer Experience
Get the GuideSales metrics
The sales process sets the stage for your customer experience—sales persons create the expectations for your prospective customers. And the response to the experience from new customers reflects how well the expectations were set by the salespersons.
There are several ways you can show the relationship between sales metrics and your customer experience program efforts. Here are some examples:
NPS asks the question, “Would you recommend our product or service to your friends or family, why or why not?” While the overall NPS score helps you see the patterns, the responses to why or why not provide a lot of information about your customer’s expectations and the variance of their experience. If most of the disappointed customers report feeling the experience isn’t meeting what the sales process promised, then you may have an issue with setting expectations early in their journey.
If your sales cycle is getting shorter, you may have your customer experience to thank. To understand the connection, look at the numbers of inbound prospects. If more prospects are seeking your brand out, then your customer experience is most likely improving.
Customer Effort Score (CES) is often a leading indicator for better word-of-mouth (WOM) marketing. As your customers feel like your brand provides an easier, more effortless experience, they will more likely advocate for your brand. Positive word-of-mouth marketing leads to more proactive sales. Are your prospects completing your web form and signing up for your products? More referrals lead to higher sales.
Cost of customer service
Customer service can be a pricey department. For instance, there are many expenses behind the technology, tools and real estate of a contact center. The expenses rise when there is high effort across this part of the customer journey.
But when your customers are happy, they don’t need to call into your contact center to complain or request help; they are moving through their journey with ample guidance and the right expectations. All of this means that a company’s service resources are optimized as they should be.
This is all to say that better customer experience metrics often lead to reductions in cost of customer service. Connecting your CX metrics, like CES or CSAT, to this type of expense reduction can be fairly straightforward. There may be a monthly lag, but as your CX scores improve, watch for your service costs to go down.
Let’s break it down with an example: On an annual basis, a company has an average of 100,000 calls into their contact center and each of those calls costs them $7.00. If, via CX efforts, the company is able to reduce the number of calls by 10% annually—which is 10,000 fewer calls—they’ll save $70,000. And the best part: the company will see an increase in customer retention and loyalty.
Customer defection
When customers leave your brand for a competitor, it’s more than just the loss of their transaction—you’re losing a relationship. It reduces the Customer Lifetime Value (which we discuss further later in this guide) and it may lead to more negative word-of-mouth marketing, more defections, and eventually an increasingly competitive marketplace.
Knowing how many customers leave your brand in a month, a quarter, a year, etc. is a very important metric to track, especially for business-to-business (B2B) or subscription models.
For example, if your CSAT or NPS scores begin to fall, watch your customer defection rates carefully. Even if you are acquiring more new customers each month, this metric should be tracked as an indication of how your current customers are feeling about your customer experience.
Churn rate
As discussed above, churn rate combines retention with new customer acquisition. This means examining the rate your customers are coming in versus how many are leaving you during a certain timeframe, typically monthly, quarterly and/or annually.
The churn rate results have an inverse relationship with your CX metrics. For example, as your Net Promoter Scores increase, your churn rate typically declines. It’s a no-brainer!
Chapter 4
A few other metrics for your consideration
As you can probably guess, there is no perfect combination of customer experience metrics to magically track the performance of your CX program. The list we’ve provided thus far is a good starting point. However, there are several other options that are less popular, but might do wonders for your company.
For instance, you might consider Customer Lifetime Value (CLV). This metric can be especially helpful for membership or subscription models, as well as other long-term customer cycles. One way to calculate CLV is using the Average Annual Revenue per Customer multiplied with the Average “Lifetime” of your Customer, meaning how many years they have been a customer. Your CLV will be the dollar amount of that calculation and can tell you interesting things if it begins to go up or down.
Another popular metric within contact centers is First Contact Resolution (FCR). Knowing if your customer service agents can resolve customer issues the first time around can indicate the amount of effort your customers experience. This can be calculated on the overall level, or at an agent and product level. A typical calculation is using the total number of customer contacts resolved on the first attempt for a given time period divided by the total number of customer contacts in that same time period.
Tracking social media sentiment, digital behavioral analytics and employee engagement feedback can lead to even more insights. Watch your social media sentiment analytics to get an overview of how customers feel about your brand in real time. Their behavior on your digital properties—like websites, mobile apps and online search—can help you identify their points of delight or challenges in the customer journey. Lastly, how engaged your employees feel with your company is directly related to the experience they deliver to customers.
We know this catalogue of metrics might feel overwhelming. As a start, try to focus only on your top goals. You want to gain the right insights to deliver the right experience. so commit to setting up the ideal measurement system for your customer experience program; then commit to using those insights to keep improving the experience.
Editor's note: This guide was written in collaboration with CX expert Jeannie Walters.
Learn how GetFeedback can help you exceed customers’ expectations—start your free trial today.