Put customer experience at the heart of your business
Get the insights you need to delight and retain customers, and drive revenue growth with SurveyMonkey.

Why choose SurveyMonkey for CX?
Power your strategy with one platform to manage CX
With our flexible platform, it’s easy to drive action across product, marketing, and more to deliver real business value.
Get insights with speed and confidence
Start getting customer insights in days, not months with templates and intuitive analysis features.
Bring all your tools and insights together
Save time and make customer insights actionable by connecting SurveyMonkey with the tools you use everyday.
Trusted by 300K+ organizations worldwide
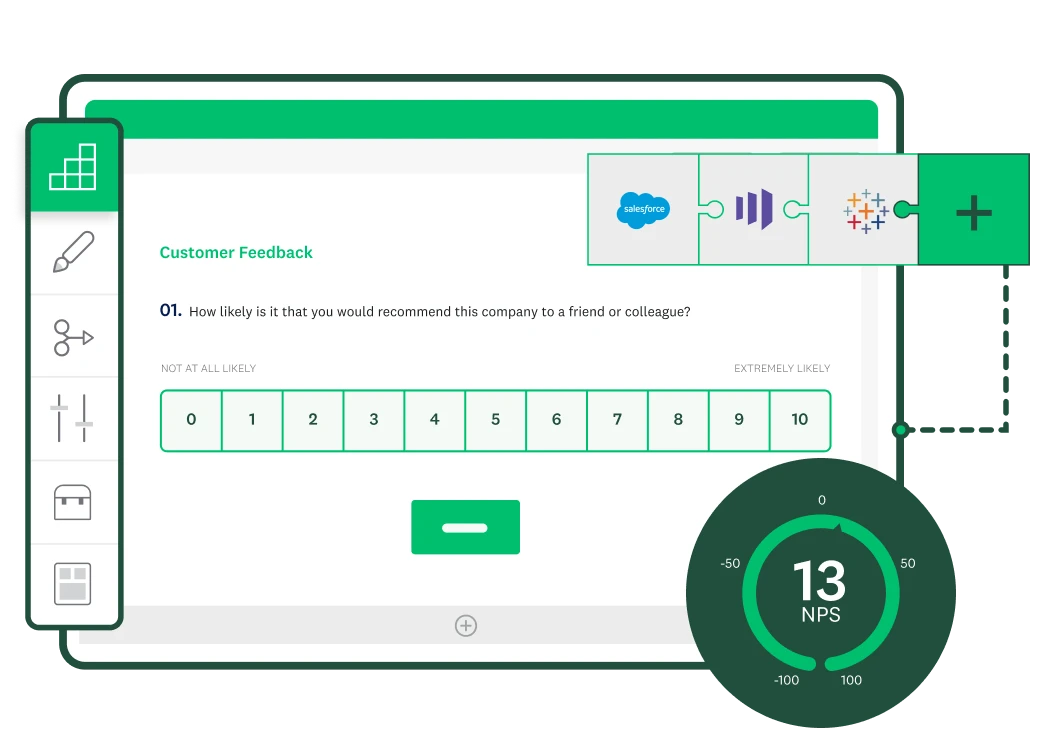
Measure, analyze, and close CX gaps
Easily benchmark customer experience using Net Promoter Score (NPS®) and Customer Satisfaction Score (CSAT) programs. Integrate data into 120+ business systems, including Salesforce, Marketo, and Tableau.
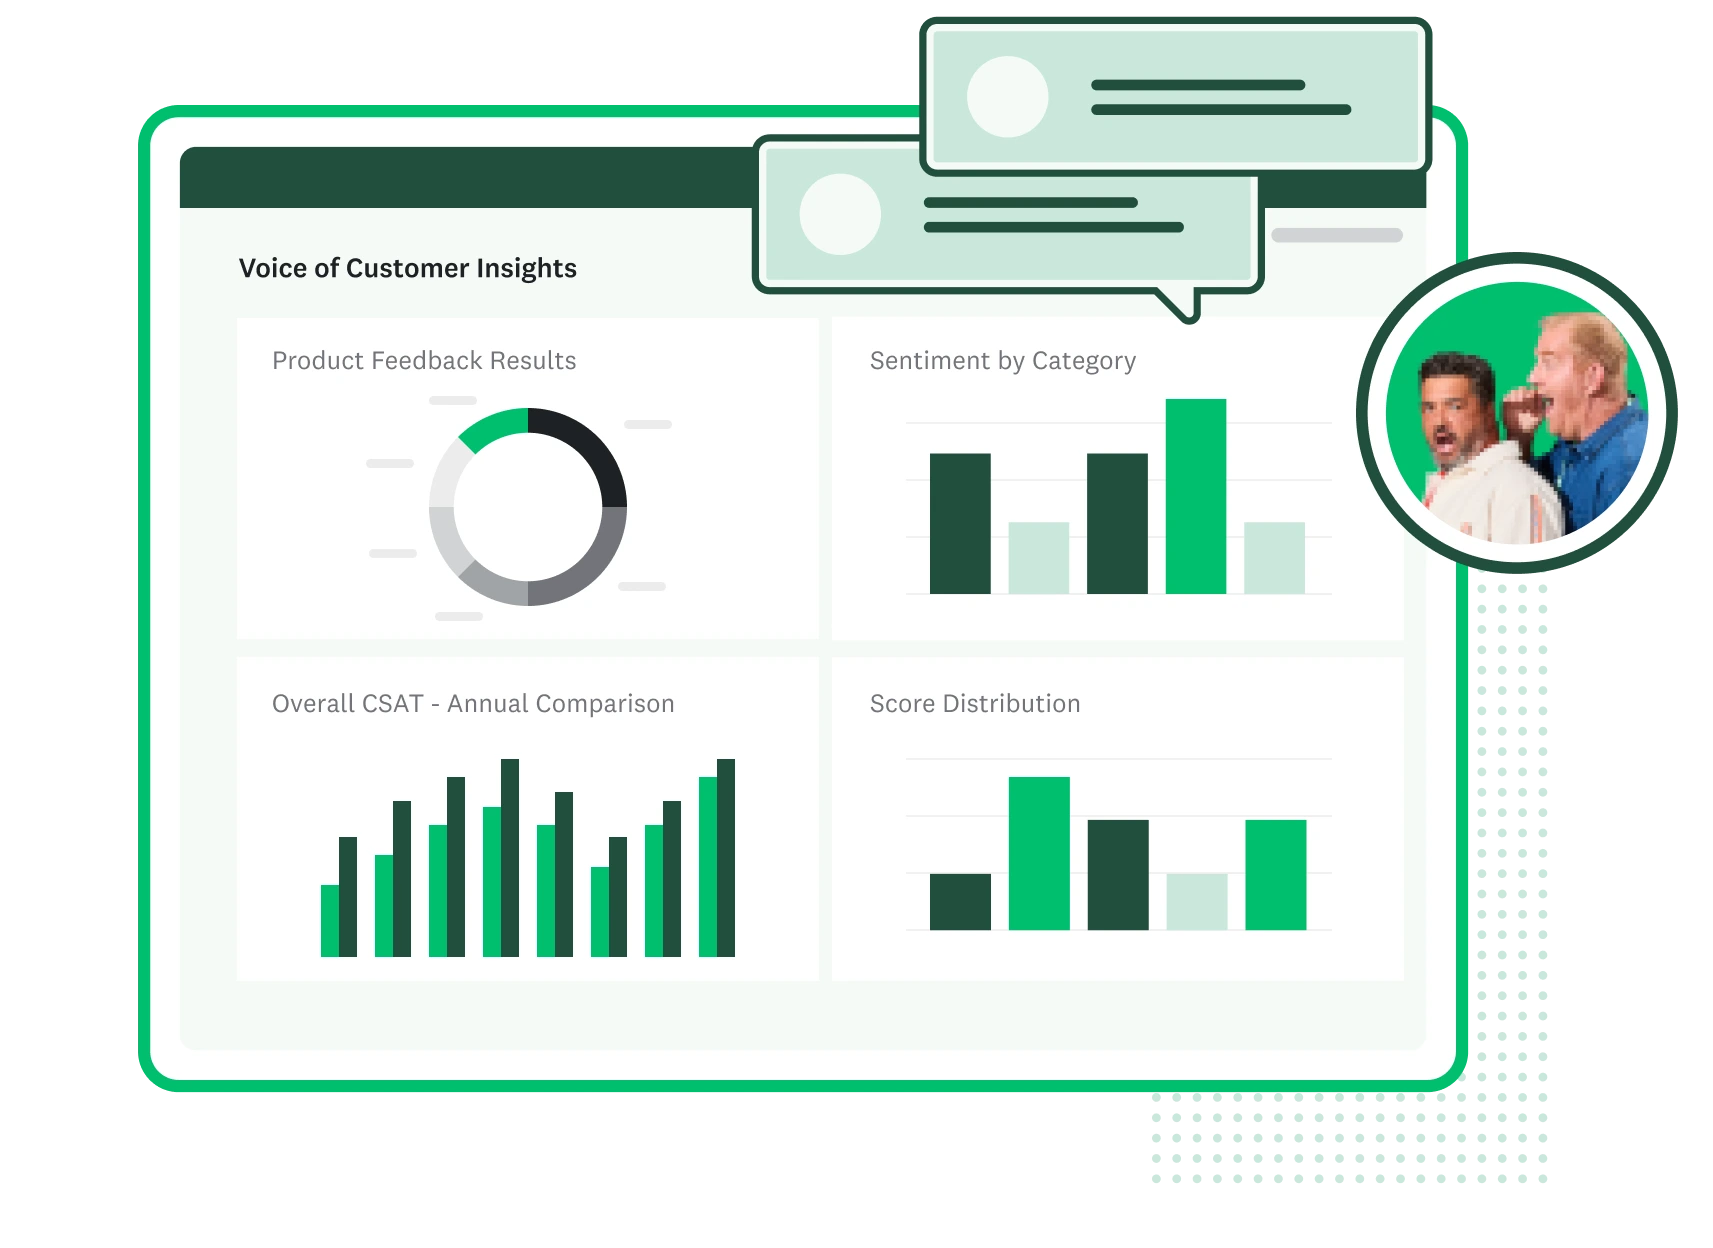
Listen to your customers to deliver exceptional experiences
Build and scale your voice of the customer (VOC) research to understand what’s working and opportunities to act. Empower teams across your organization to capture, analyze, and act on customer insights.
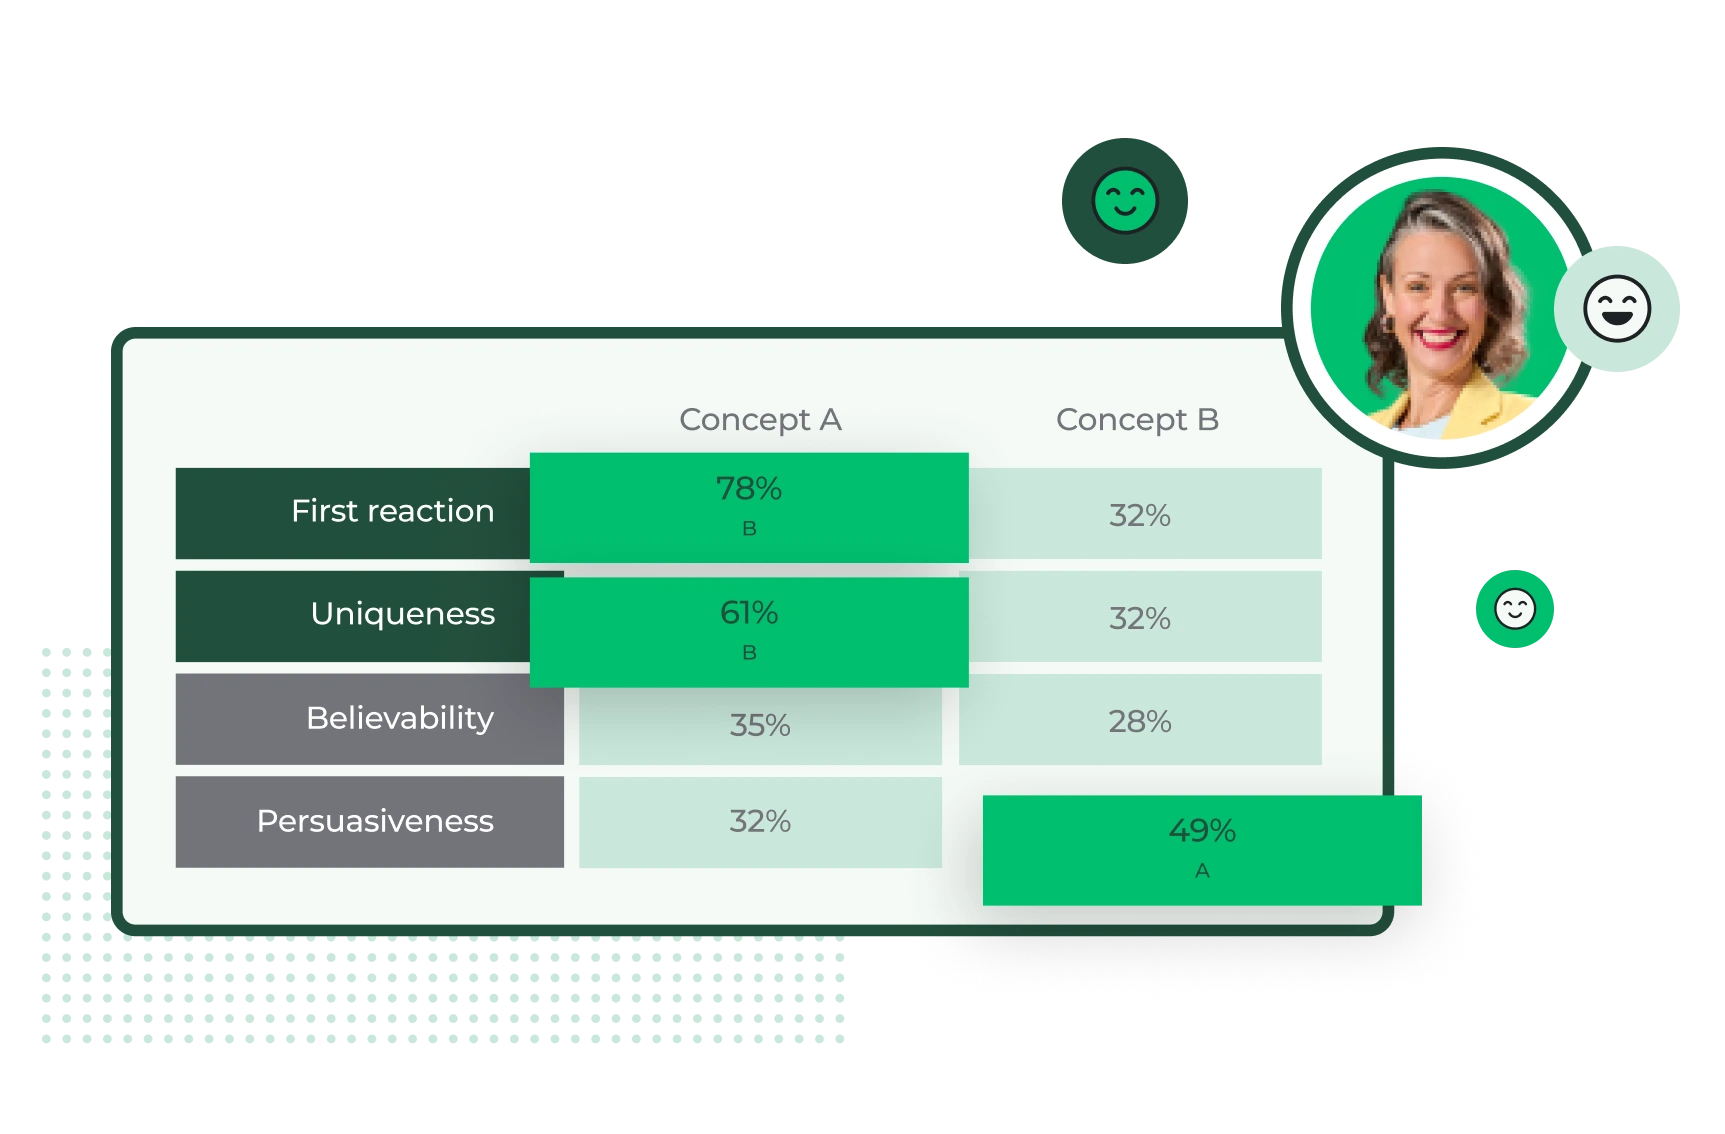
Create products and services customers love
Test product concepts and feature ideas with your target audience. Capture product feedback throughout the development lifecycle to drive adoption.
Some of the ways SurveyMonkey can help you improve the customer experience
NPS programs
Measure how customers perceive your brand through relational and transactional NPS.
Customer satisfaction
Measure customer satisfaction after key interactions to pinpoint areas for improvement.
Customer effort score
Use customer effort score (CES) insights to improve processes and minimize costly repeat interactions.
Customer service feedback
Evaluate customer support interactions and act on issues faster.
Website feedback
Survey your user base on security, design, and more to create digital experiences that delight.
Event feedback
Create experiences that attract attendees and keep them coming back with pre- and post-event feedback.
Product development
Pressure test and optimize your products to drive ROI and customer loyalty.
Market research
Get insights from your target audience in minutes with SurveyMonkey Audience.
Purchase feedback
Measure purchase satisfaction to help reduce friction in the buying process.
Choose the plan that works for you
Need an enterprise-grade solution?
SurveyMonkey Enterprise provides additional features like IT administration, SSO, user controls and permissions, HIPAA compliance, and more.

Get tips and tools to empower your CX team

Learn about trends reshaping customer experience in a survey of CX industry pros and consumers.

Discover how the SurveyMonkey and Salesforce integration can help supercharge your CX strategy.

Find out how Box captures insights across the customer journey and breaks down data silos.

Learn how Lionbridge increased customer satisfaction with SurveyMonkey and Power BI.
Request a demo today
Ready to make CX your competitive advantage?
Net Promoter, Net Promoter Score, and NPS are trademarks of Satmetrix Systems, Inc., Bain & Company, Inc., and Fred Reichheld.